
Table of Contents:
- 10 useful commands for server monitoring on Linux
- top
- htop
- iotop
- nload
- iftop
- 10 useful commands for server monitoring on Linux
- vmstat
- sar
- apachetop
- 10 useful commands for server monitoring on Linux
- tail
- netstat
Last updated December 6th, 2023 00:16
If you manage your own server on any Linux operating system, it is useful to familiarize yourself with several basic monitoring commands. When your server is running out of breath, it’s good to be able to identify the process that is slowing it down. Let’s take a look at 10 useful commands for server monitoring on Linux that will tell you more about its performance and what is currently happening on it.
10 useful commands for server monitoring on Linux
top
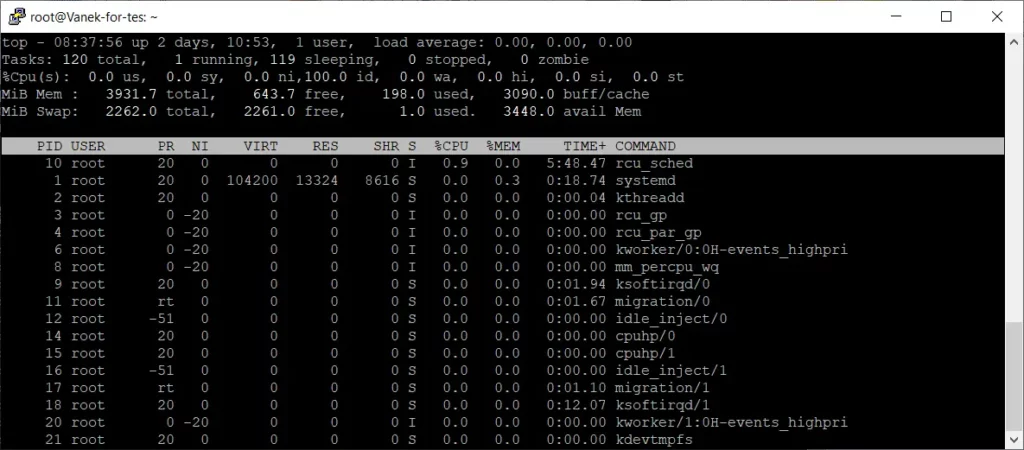
The “top” command is a tool for monitoring running processes on a Linux server. When you run it, you will see an interactive overview of process information. You can view CPU usage, memory usage, resource allocation, a list of running processes, and other important details. The overview is refreshed at regular intervals. The “top” command is especially useful for monitoring server performance and identifying processes that consume excessive resources. To exit the “top” command, simply press the “q” key.
htop
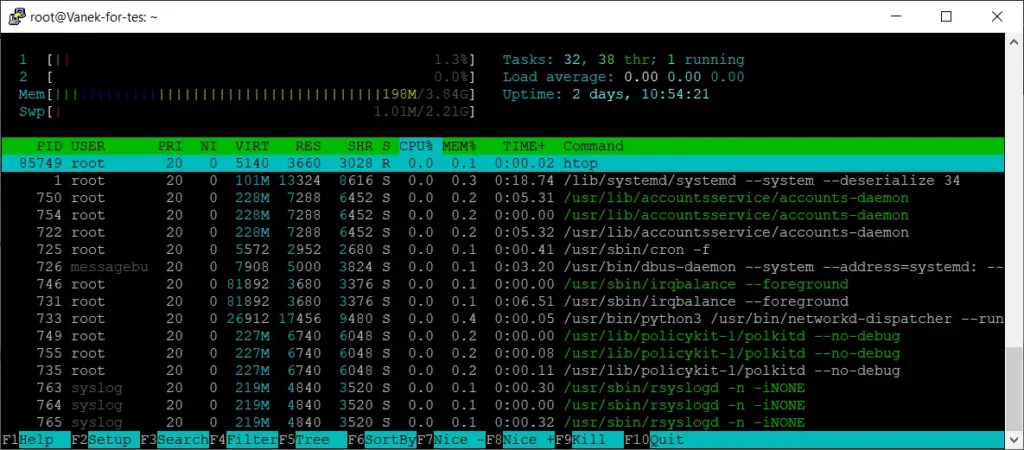
Htop is an interactive system monitoring tool that provides more detailed and organized information about running processes on a Linux server compared to the standard “top” command. When you launch “htop,” you will see a colorful and interactive overview of running processes, including details about CPU usage, memory usage, disk activity, and network traffic.
Htop also offers options for interacting with individual processes. For example, you can select a process and use keyboard shortcuts to change its priority, terminate it, or investigate its activity in more detail. Htop is useful for analyzing server performance, identifying causes of overload, and pinpointing processes that consume excessive resources.
To exit the “htop” command, you can press the “q” key. Htop is a highly capable monitoring and system management tool that will help you gain a better understanding of the running processes on your server.
iotop
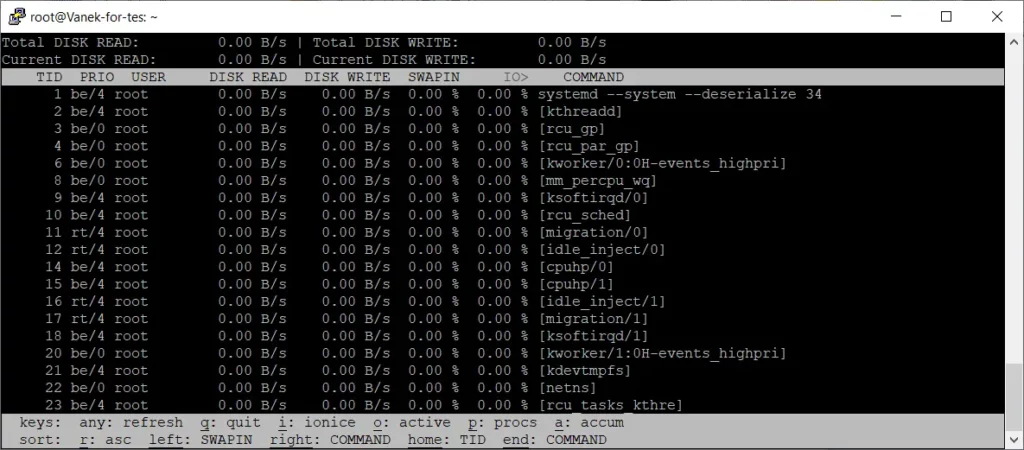
Iotop is a Linux command designed for monitoring input/output (I/O) operations on a server. When you run “iotop,” you will see a list of running processes that are performing I/O operations, along with information about their disk usage.
The overview shows you which processes are consuming the most disk resources and how much data they are reading or writing. This way, you can identify potential disk performance issues, overloaded processes, or inefficient operations. You can also see which processes are causing real-time disk reads or writes.
Iotop is a useful tool for diagnosing disk performance issues on a server and allows you to better understand how processes on your system utilize I/O operations. To exit the “iotop” command, you can press the “q” key.
nload
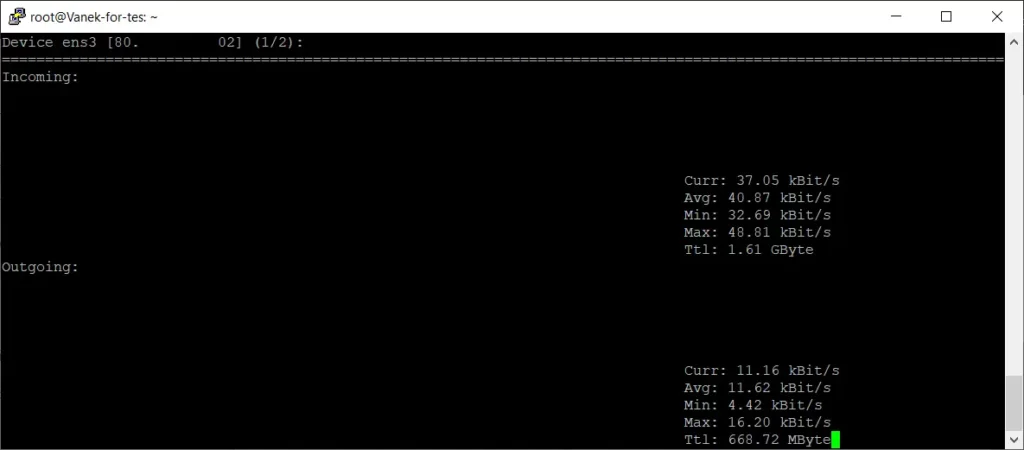
Nload is a tool for monitoring network traffic on a Linux server. When you run “nload,” you will see an interactive real-time overview of network utilization.
The overview displays data transfer rates (transmitted and received) for each network interface. The graphical representation allows you to monitor changes in network traffic and detect potential issues such as high loads or network attacks.
Nload is a useful tool for monitoring and diagnosing network traffic on a server. It provides a clear and easily readable view of current network usage. To exit the “nload” command, simply press the “q” key.
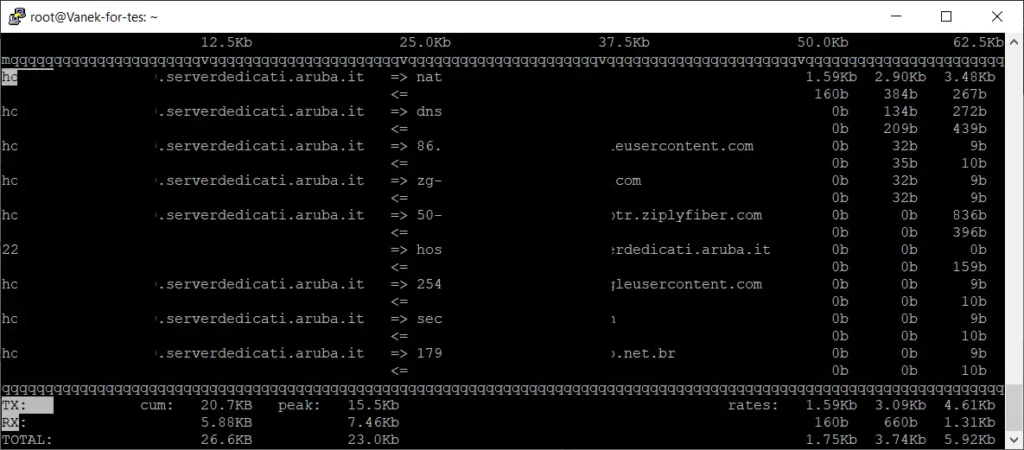
iftop
Iftop is a tool for monitoring network traffic on a Linux server. When you run “iftop,” you will see an interactive real-time overview of current network traffic.
The overview displays data transfer rates (transmitted and received) for individual network connections. You can see which IP addresses are involved in the communication, which ports are being used, and how much data is being transferred. It also shows statistics such as average data transfer speed and maximum transfer speed.
Iftop is a useful tool for monitoring current network traffic on a server. With it, you can identify actively communicating addresses, monitor data transfers between different devices, and detect potential network issues.
10 useful commands for server monitoring on Linux
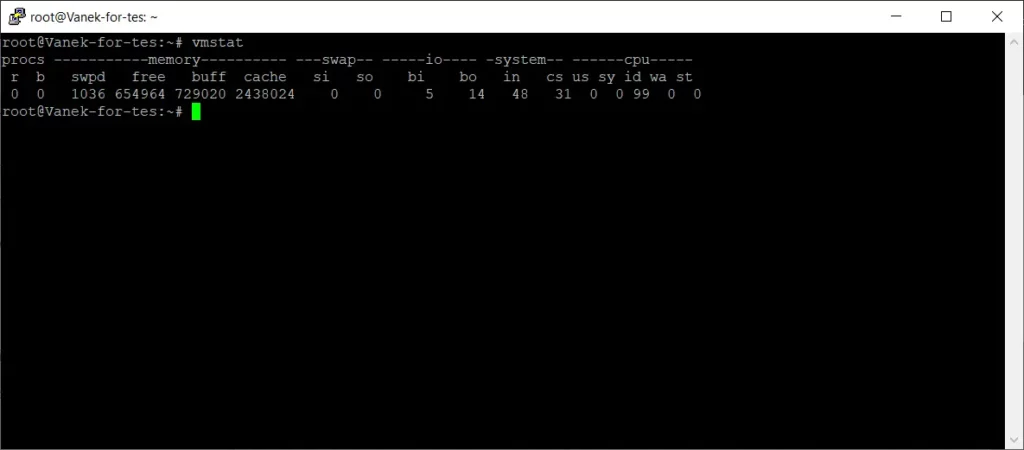
vmstat
Vmstat is a tool for monitoring system performance and displays resource utilization statistics on a Linux server. When you run “vmstat,” you will see a concise table with various metrics.
The table provides information about CPU usage, memory usage, swap activity, input/output operations (I/O), the number of running processes, and other important parameters. You can see the CPU utilization percentage, the amount of free and used memory, disk data transfer rates, data swapping between memory and swap, and more.
sar
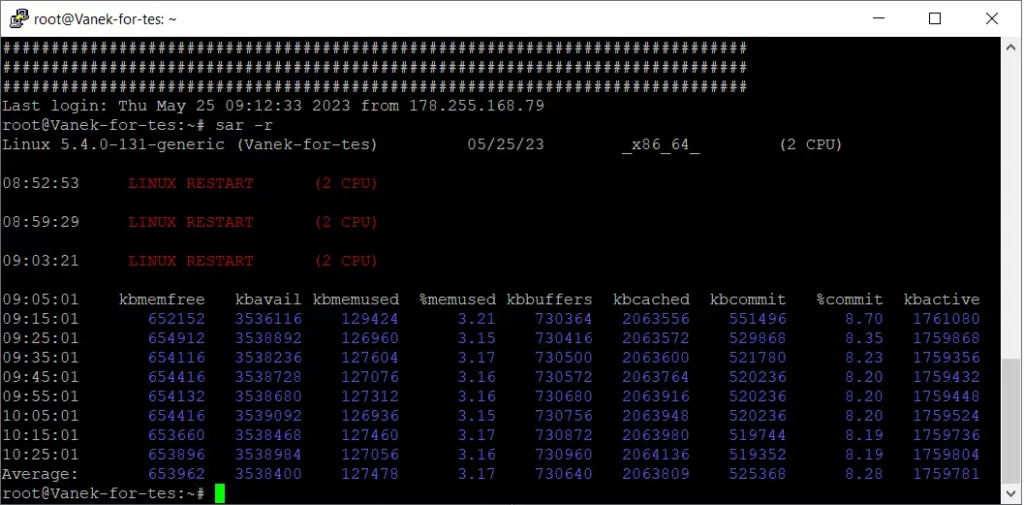
Sar is a tool for collecting and analyzing system performance statistics on a Linux server. When you run “sar,” you will see various statistics related to CPU usage, memory, disk, network traffic, and other aspects.
Sar gathers system performance data from various sources and presents them in a structured form. These statistics may include information about CPU load, memory consumption, disk data transfer, network traffic, system activity timestamps, and other measurements.
Sar is useful for analyzing and monitoring server performance. With it, you can identify system overload, uncover resource usage trends, detect anomalies, and optimize the configuration and resources of your server.
Details on the usage and command options of “sar” can be found in the documentation. Sar provides a comprehensive set of system performance statistics and helps you better understand and manage the performance of your server.
Installation and setup of sar:
To install and start the “sar” tool and configure data collection, you need to follow several steps:
Install sar: First, make sure the “sysstat” package is installed on your system. If not, you can install it using the system package manager. For example, for Debian or Ubuntu-based systems, you can use the following command:
sudo apt-get install sysstat
Data collection configuration: After installing “sysstat,” proceed to configure data collection using “sar.” Open the “sysstat” configuration file in a text editor. For Debian or Ubuntu-based systems, the file path may be “/etc/default/sysstat.”
sudo nano /etc/default/sysstat
In the configuration file, locate the line that contains the “ENABLED” variable. Ensure that it is set to “true”. If it is set to “false”, change it to “true”.
Service Restart: After making changes to the configuration, you need to restart the “sysstat” service for the changes to take effect. You can do this using the following command:
sudo systemctl restart sysstat
Scheduling Data Collection with the “sar” Command using Cron
To collect data regularly, you can create cron tasks. Cron is a system scheduler that allows you to execute tasks at specified time intervals. Statistics collection can occur every minute or at any other defined interval. The default collection interval is set in the /etc/cron.d/sysstat file. Here is an example of a cron command for collecting data every 10 minutes:
5-55/10 * * * * root command -v debian-sa1 > /dev/null && debian-sa1 1 1
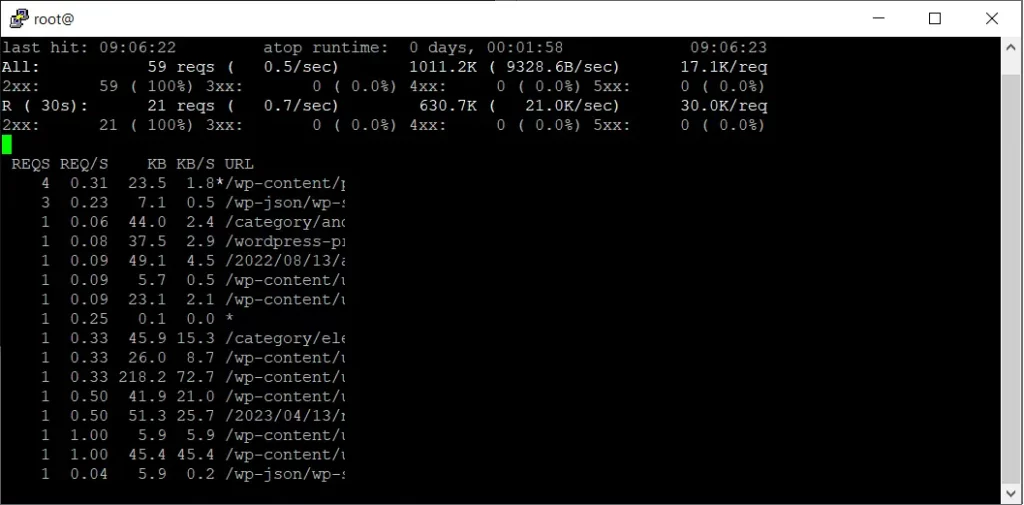
apachetop
Apachetop is a tool designed for monitoring traffic on an Apache web server. It provides an interactive overview of current requests, connections, and transfer speed on the server. Unfortunately, the “apachetop” command is not a standard component of Linux distributions and is not a default tool for server monitoring.
Installation of apachetop
sudo apt install apachetop
You can use the following command to install the “apachetop” tool on Linux distributions based on the APT package management system, such as Debian or Ubuntu. This command will install the “apachetop” package and its dependencies.
After a successful installation, you can run the “apachetop” command in your terminal. It will display an interactive interface that shows statistics about the traffic on your Apache server. You can monitor the number of requests, status codes, top IP addresses, data transfer speed, and other information.
You can navigate through the overview and display more information using the up and down arrows. To exit the “apachetop” command, simply press the “q” key.
10 useful commands for server monitoring on Linux
tail
The “tail” command is used to display the last lines of a text file. It is a useful tool for monitoring logs and tracking the current output at the end of a file. Using the “tail” command is straightforward. The basic syntax is as follows:
tail [možnosti] [soubor]
When you run the “tail” command without any additional options or arguments, it displays the last 10 lines of the specified file. For example, if you want to display the last 10 lines of the file “logfile.txt”, you can use the following command:
tail logfile.txt
There are also some useful options you can use with the “tail” command:
- -n <number>: Displays the last <number> lines. For example, “tail -n 20 logfile.txt” will display the last 20 lines.
- -f: Monitors the file in real-time and displays newly added lines. This option is useful for monitoring logs. For example, “tail -f logfile.txt” will monitor the file and display new lines as they appear.
Here’s an example of displaying the last 10 lines of the Apache error log:
tail -n 10 /var/log/apache2/error.log
netstat
The “netstat” command is used to display network state and statistics on your computer. It provides information about active network connections, open ports, network interfaces, and other network statistics.
The basic syntax of the “netstat” command is as follows:
netstat [syntax]
Some of the most commonly used options of “netstat” are:
- -t or –tcp: Displays information about TCP connections.
- -u or –udp: Displays information about UDP connections.
- -n or –numeric: Displays numerical addresses and ports instead of resolving them to names.
- -l or –listening: Displays only active listening connections.
- -p or –program: Displays processes associated with network connections.
- -r or –route: Displays the routing table.
- -s or –statistics: Displays detailed network statistics.
The website is created with care for the included information. I strive to provide high-quality and useful content that helps or inspires others. If you are satisfied with my work and would like to support me, you can do so through simple options.
Byl pro Vás tento článek užitečný?
Klikni na počet hvězd pro hlasování.
Průměrné hodnocení. 0 / 5. Počet hlasování: 0
Zatím nehodnoceno! Buďte první
Je mi líto, že pro Vás nebyl článek užitečný.
Jak mohu vylepšit článek?
Řekněte mi, jak jej mohu zlepšit.

Subscribe to the Newsletter
Stay informed! Join our newsletter subscription and be the first to receive the latest information directly to your email inbox. Follow updates, exclusive events, and inspiring content, all delivered straight to your email.
Are you interested in the WordPress content management system? Then you’ll definitely be interested in its security as well. Below, you’ll find a complete WordPress security guide available for free.